Tanzu End to End Demo
- The code for the demo is here
Set up environment
Welcome to the Tanzu End to End demo! In this session, we’ll be exploring the capabilities of Tanzu Advanced Edition, and see how they would be used in an actual software lifecycle scenario.
We’re going to be using Tanzu to deploy an application, deploy dependent services for that application, observe the metrics for that application and supporting infrastructure, and manage the cluster hosting that application.
Harbor
Use the following link to sign into the Harbor Web UI with the username “admin” and password “R4z7bGIqxMfFDzTx”. (You will be redirected to the sign-in page)
https://harbor.amer.end2end.link/harbor/projects/684/repositories
ArgoCD
Log into ArgoCD with username ‘admin’ and password “R4z7bGIqxMfFDzTx”:
https://argocd.amer.end2end.link/applications/e2e-workshop-w01-s044
SaaS Services
Important: For the next sections, it is vital that you make sure to sign-in to cloud.vmware.com with your @vmware.com email address and select the “Tanzu End to End” organization. Please be careful not to alter the services or configurations of the clusters in these environments as they are shared for the entire End to End Demo Environment.
Click below to sign in. If you can’t see this organization, you can self-enroll into the organization at https://via.vmware.com/tanzu-e2e-demo
https://console.cloud.vmware.com
Tanzu Observability
Open a tab to Tanzu Observability for your Pet Clinic Dashboard. First, you will need to sign in to the following Wavefront instance.
https://vmware.wavefront.com/u/GVQsHYwxZC?t=vmware
If you are having trouble accessing this instance, make sure you have the Wavefront-sandbox app added to your Workspace One account. You can access that app at https://myvmware.workspaceair.com/catalog-portal/ui#/apps/details/WORKSPACE-d689139a-9b94-4b6f-aa23-915763e9b149-Web-Saml20, and then try to click the link above.
Tanzu Mission Control
Open a tab for Tanzu Mission Control
https://tanzuendtoend.tmc.cloud.vmware.com/clusterGroups/end-to-end
Tanzu Application Catalog
Open a tab to Tanzu Application Catalog. Make sure to select the “Tanzu End to End” org if you are prompted.
https://tac.bitnami.com/apps
Tanzu Service Mesh
Open tab to Tanzu Service Mesh to the e2e-demo Global namespace by clicking the link below. If you don’t see the graph for the Global Namespace showing the e2e-eks and e2e-tsm1 clusters, make sure to select the “Tanzu End to End” org, close the tab, and then reopen it again with the link below.
https://prod-2.nsxservicemesh.vmware.com/global-namespaces-detail/e2e-demo/gns-topology
Tab Staging
Reorder your tabs in this way so that your demo flow goes left to right:
- This workshop
- TAC
- ArgoCD
- TMC
- TO
- TSM
Frameworks and Services
You want your developers to create resilient applications that are easy to operate and can scale to meet demand. We’re going to start our story with Cody. He’s not a deep expert on container infrastructure, but he’s an absolute star in writing business applications using popular languages and frameworks.
Tanzu supports developers as they are creating or modernizing applications. VMware is the company behind the most popular Java development framework in the world, Spring Boot. Spring Boot is popular because it provides developers everything they need to create microservices that power some of the world’s most heavily used applications such as Netflix. It provides modern, reactive services for high performance applications, robust and simplified access to supporting application services like relational databases, messaging services like Kafka, and built-in observability and manageability features that make those applications much easier for operators to run.
Cody has chosen to write his new web app in Spring Boot, and he knows the best place to start is https://start.spring.io.
https://start.spring.io/ From this interface, developers can quickly find the services they need to start their projects using the latest frameworks employing the most modern best practices for cloud native applications.
Add dependencies for Actuator, Kafka, and Reactive Web, then click the “Explore” button to show the project that would be generated. This accelerates developer productivity!
VMware also invests in the popular Steeltoe project which provides a similar experience for .NET developers
https://start.steeltoe.io/ And developers don’t have to learn all of these cloud-native practices themselves! Tanzu’s “Pivotal Labs” team has decades of experience helping organizations rapidly deliver outcomes that matter to your business. They have entire practices geared towards delivering net-new applications, as well as an extensive practice to help large organizations understand and modernize their existing applications to take the best advantage of cloud application benefits.
So now that we have an application, let’s explore how Tanzu supports delivering that application as a container.
Automated Container Creation
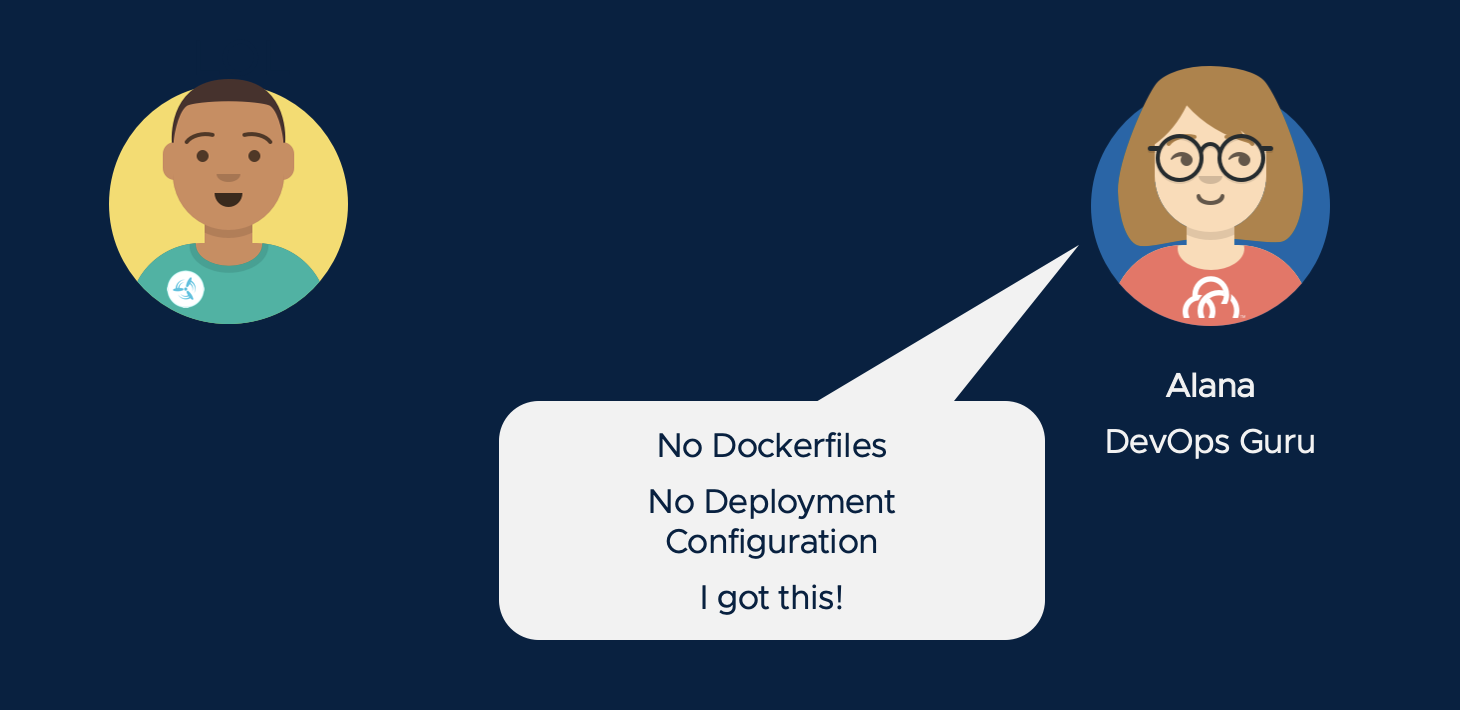
Cody is using the best frameworks and practices in developing his application code, but now he needs to package that code up for delivery so that it can be run. But Cody isn’t always current on best practices for designing, securing, and optimizing the performance of containers. And patching/updating container dependencies is a chore.
Fortunately, Cody has a partner in crime named Alana. She is the DevOps guru who operates the company’s Kubernetes clusters, and she’s got a plan for automating the container build process so that it happens the right way, every time.
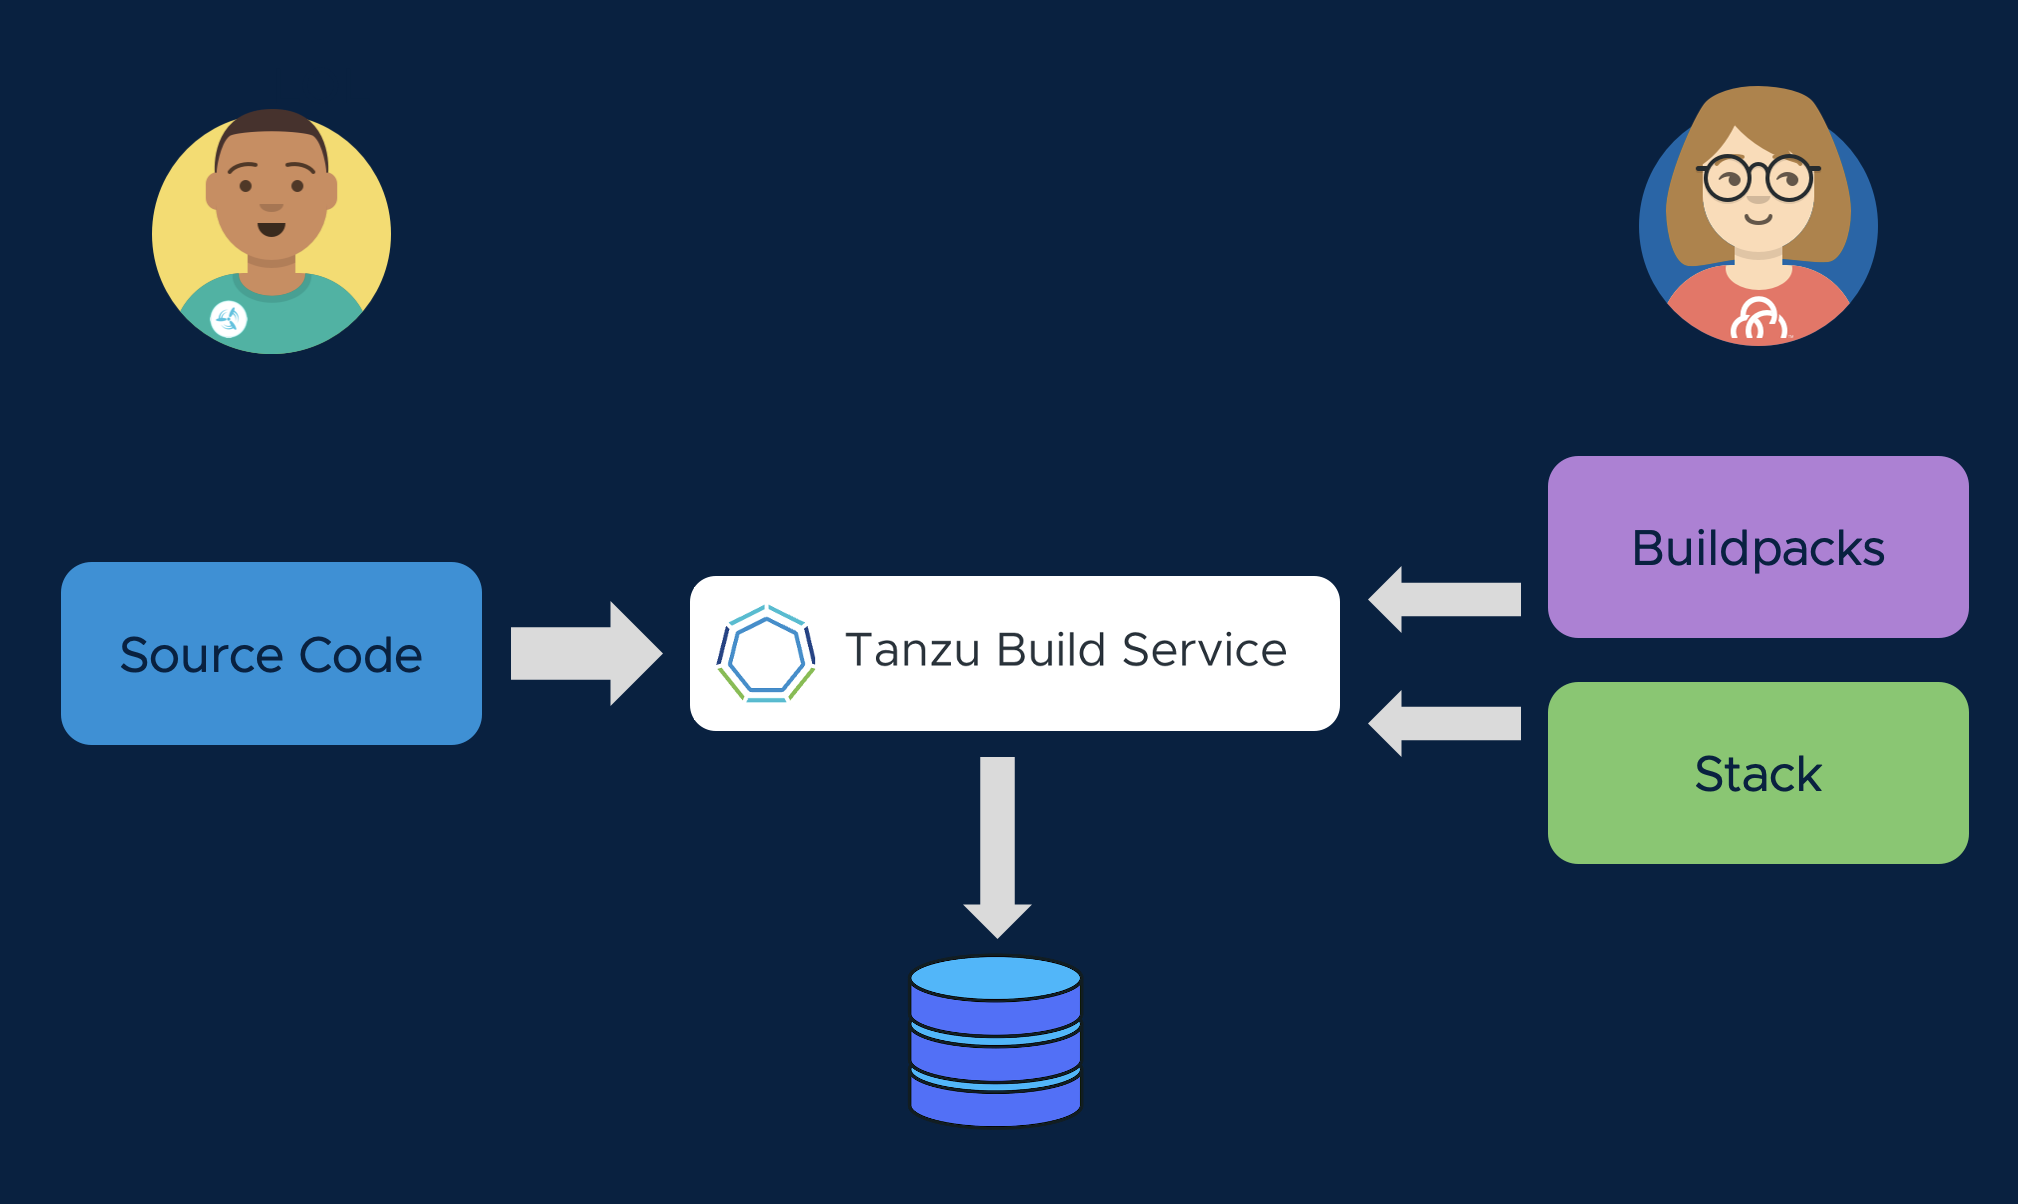
Alana’s secret weapon is Tanzu Build Service. TBS enables a clear separation of roles, where developers like Cody supply the source code that will be used in the application container image, but operators like Alana specify container design templates. Alana uses Cloud Native Buildpacks supplied by VMware. Buildpacks produce container images for a broad range of language runtimes, and they have been optimized for security performance.
These buildpacks are updated several times a month by VMware, to include the latest application runtime dependencies and security fixes. Alana also selects a stack (a base OS image for the container) from VMware. VMware stacks are also rapidly updated, providing protection from the latest CVEs.
Let’s see how this works. With Tanzu Build Service, we will create an image. This is a mapping of Cody’s source repo (or the application artifact produced by Cody’s CI pipeline) to a container image in our Docker registry. Remember that the artifact Cody provides does not contain Dockerfiles, Kubernetes manifests, or anything else that requires knowledge of the specific container runtime environment that the application will run in. All of that information will be generated, in an automated and consistent way, during the Tanzu CI/CD process.
kp image create spring-webdb -c demo-cluster-builder --tag harbor.amer.end2end.link/e2e-workshop-w01-s043/spring-webdb --local-path ~/spring-webdb.jar
A build will be triggered when an image is created, or when the application’s source code is updated. Use this command to stream the build logs as you describe the buildpack process.
kp build logs spring-webdb
Tanzu Build Service recognizes Cody’s source code as Java, and employs a Java Buildpack to create a container image that runs the application. The container image will include VMware’s best practices for container design, and the latest dependencies. Cody does not need to be a containerization expert to produce a secure, performant image.
Tanzu Build Service is an important tool for Day 2 Operations as well. Alana can update the buildpacks, or the stacks, and TBS will automatically trigger a rebuild of all affected containers in her environment. This means Alana doesn’t have to work through Cody to keep her container runtimes patched and secure.
Surprise! In the previous command, we actually told Tanzu Build Service to run that build with an outdated OS image, riddled with security vulnerabilities. Let’s see what happens when our Alana tells Tanzu Build Service to use publishes a new stack (base image), triggering a rebuild of the affected container without getting Cody involved:
kp image patch spring-webdb --cluster-builder default
See how the image is quickly rebuilt:
kp build list spring-webdb
Registries are More than File Servers
We’ve been publishing our container images to Harbor, the open source registry that’s supported as part of the Tanzu portfolio. Harbor provides capabilities for hosting container images that go far beyond a simple “file server.” Harbor acts as another control point in your infrastructure that prevents images that don’t meet your security standards from ever reaching your application clusters. It shifts security checks to an earlier phase in the application lifecycle, and enables Alana to manage a secure software supply chain.
Let’s look at Harbor to see how this works. Click the link below to navigate to your project page in Harbor.
We can see that Tanzu Build Service has created a new application container image, ready to deploy!
Click on the image name.
On the detail view, we can see there are two tagged versions of the image, published a few minutes apart. The first image was produced using the base OS layer from a few months ago, and the second image was built using the recent patched image that Alana received from VMware.
Hover over the “X Total” count in the Vulnerabilities columns to see an overview of the security scan results. We can see how Tanzu Build Service radically improved our security posture by ensuring our image builds are current, and Harbor gives us direct visibility to verify that posture.
Click on one of the sha256:.... links, and scroll down to show the CVE list for that image. Open up a CVE and highlight the description. Then click on the “I” icon to show the links to the relevant CVE reports.
Now, scroll back up to the top of the page, click on the project name (e2e-workshop-…) and go to the “configuration” tab in the top-level menu. Call out the “Automatically scan images on push” checkbox and how that works with the “Prevent vulnerable images from running” function. This feature allows blocking images from being pulled that have a certain level of severity of CVE.
Call out the “Enable Content Trust” setting that requires images to be signed to ensure they haven’t been modified before they can be pulled.
Highlight the “Helm Charts” top-level to mention that Harbor also hosts Helm charts, which is important for the TAC discussion.
Service Catalog
Remember earlier when we talked about how developers might want to pull in other containers that support their applications. Even if those containers aren’t affected by critical CVEs, they might not be configured to deployed in the most secure way possible. Wouldn’t it be great to address security concerns even earlier in the app lifecycle so that your developers are choosing services that have already been approved for use? And wouldn’t it be great to give those development teams a leg up on running those services the way you’d want them run in production?
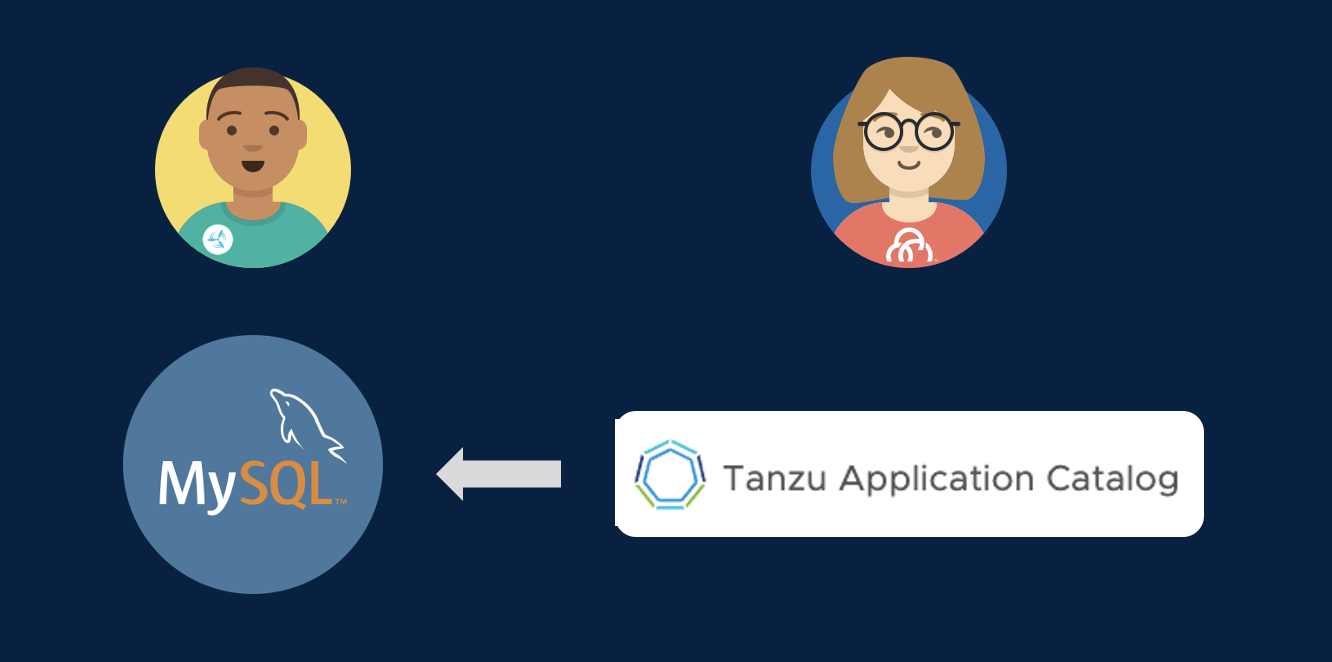
Tanzu provides a catalog for services that you can offer to your developers so that they start off on the right foot much sooner and choose services that already meet your standards. And VMware Tanzu also provides hardened images for those services that already capture the best practices for running those services in the most secure way.
Let’s take a look at those capabilities.
Go to the browser tab logged in to Tanzu Application Catalog. Click through the Application pages to get a sense of the breadth of data and application services available in the catalog. Highlight any that might be relevant for your customer. Type “mysql” in the “Filter your catalog” field on the left. Show that a container image and a helm chart are available as deployment options. Explain that each container image in TAC is built from source by VMware, secured by CVE scanners and antivirus scanners, and run through automated functional tests to ensure the container is working. Talk about how the customer has a choice of operating systems to use as the base image for a container, or they can supply their own golden base image. Click on the Details link to the right of the MySQL Container Image. Show how the customer has access to the security and validation reports that were run when the container was built. Optionally, return to the TAC homepage, and click on the “Add New Applications” button to show how customers can add their own customized artifact to the Catalog. Cody needs a relational database backend for his spring-webdb application, so he’ll be using a containerized deployment of MySQL from the Tanzu Application Catalog!
Continuous Delivery
In our CI (Continuous Integration) process, we used Tanzu Build Service to synchronize our Git source repos to the container images that will run out applications.
Similarly, for our CD (Continuous Delivery) process, we want to use GitOps tooling to synchronize Git deployment repos to the running state of our cluster. Tanzu Advanced Edition works well with any GitOps tooling. For this workshop, we have decided to use ArgoCD. Let’s examine the ArgoCD app that will manage deployment of our web application and database.
Let’s set a watch for tracking the progress of our deployment:
k get pods -w -l "app in (mysql,webdb)"
Go to the ArgoCD browser tab
Click on the application tile with the yellow highlight to view the deployment configuration for our application. The application operator manages a Git repo that stores the deployments, configmaps, secrets, and ingresses needed to run and access our application.
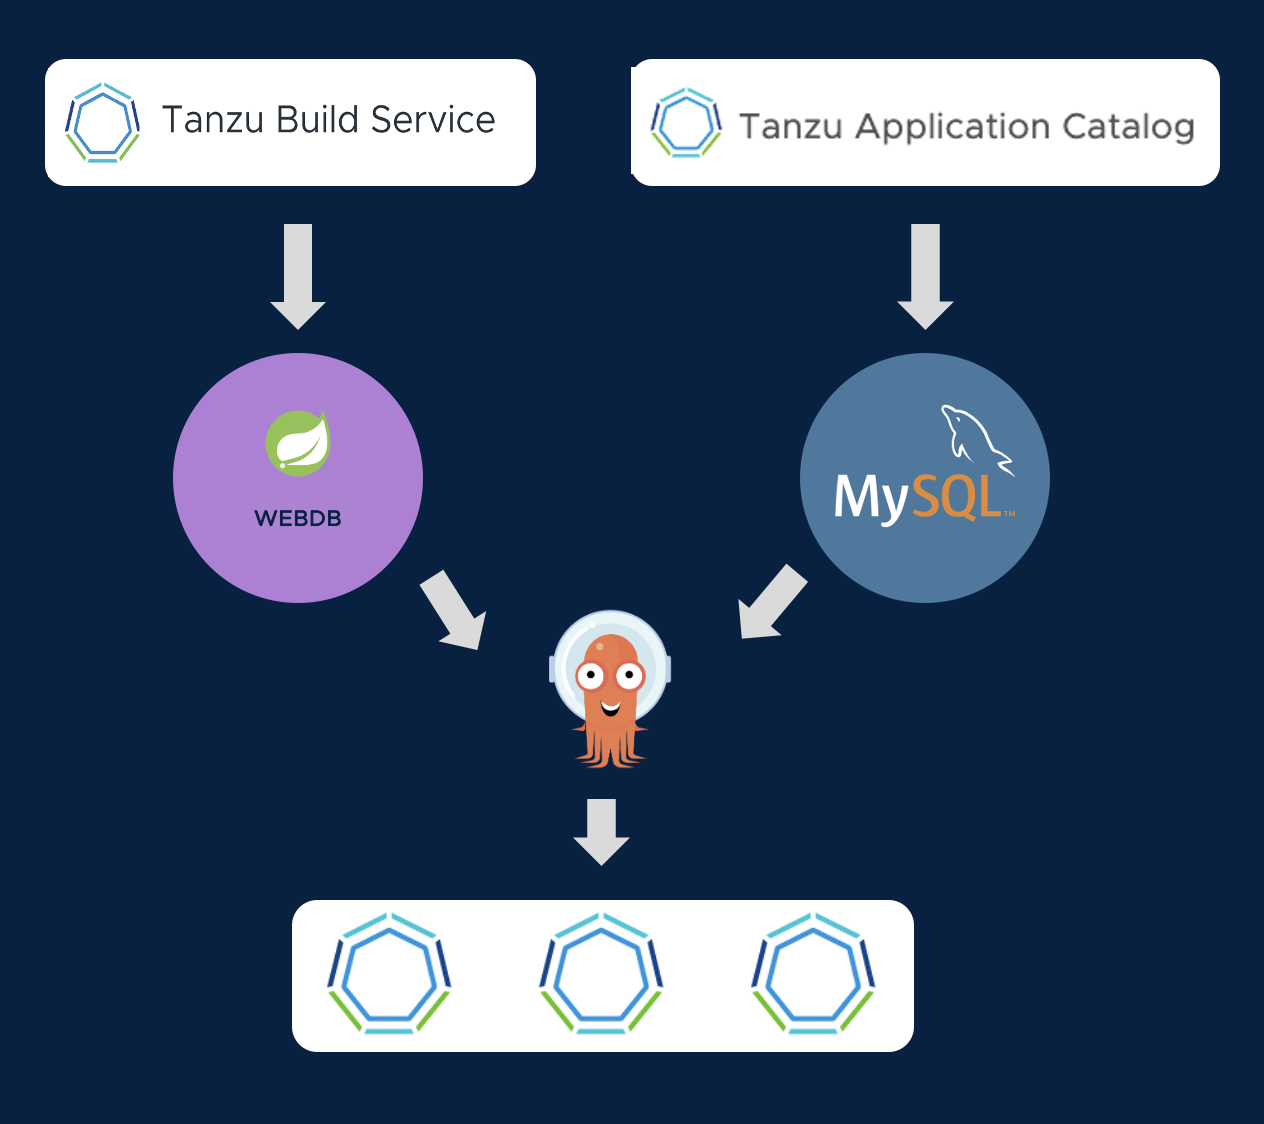
The deployment for our Spring application uses the container image that was generated by Tanzu Build Service. And the deployment for our MySQL database uses the container image published by Tanzu Application Catalog. So we can be confident that all of our containers have been built securely.
Press Sync on the ArgoCD console (and then press Synchronize on the callout dialog) to begin deployment of the application. ArgoCD will begin syncing the declared state of the deployment in the Git Repo to the running state of the cluster. In the UI, you will see the Kubernetes resources from the GitOps repo begin to come online in the cluster.
It will take a few minutes for the MySQL database to deploy from scratch, and for the Spring application to successfully connect. In the watch you set, wait until the webdb pod shows 1/1 containers ready (it will crash and restart a couple of times while it is waiting for MySQL to come up).
https://webdb-e2e-workshop-w01-s043.amer.end2end.link Pressing the “Add Sensor” button will make writes to the attached MySQL database.
Deployment Iteration
We now have a process for safely iterating on our application. When our developer commits changes to the Git repo, Tanzu Build Service will create an up-to-date image with its secure code-to-container pipeline.
But what if we want to change the configuration of our Kubernetes deployment? That will be managed by the application operator. Here is the structure of the GitOps repo they manage:
tree ~/spring-webdb-config
Let’s make a change to the ConfigMap in the dev deployment, which will produce a visible change in the application. Try updating the web.bannerText message, and change the web.bannerTextColor from DarkCyan to an HTML color you find pleasing. Like Salmon!
nano ~/spring-webdb-config/dev/configmap.yaml
When you have made the change, press Control-X to save and exit. Commit your change, and push it to your GitOps repo:
git -C ~/spring-webdb-config commit -a -m "Application Configuration Change"
git -C ~/spring-webdb-config push -u origin main
Now, go back to the ArgoCD console and sync again. Your changes will be deployed, and the pod will restart with the new configuration.
A GitOps approach makes it easy to review, audit, and control access to your deployment configuration. And it allows developers to focus on their source code, without needing to master the details of Kubernetes.
The new app should deploy in about a minute. Once the new webdb pod shows 1/1 containers ready, we can access the application here
Centralized Cluster Management
So now we have our application, and our database service deployed to one cluster. But the landing zone for your applications isn’t likely to just be one cluster. You have multiple datacenters, and increasingly one more of those datacenters is in the public cloud. Your applications are going to land on clusters that are provided for you by another provider, or are managed for you as a service in the public cloud. Are all those clusters set up and secured according to best practices and meeting your standards?
Tanzu includes a supported, standards compliant Kubernetes distribution that can run across both public and private clouds and is closely aligned with the open source, upstream Kubernetes. Tanzu makes it simple for your administrators to deploy and manage Kubernetes everywhere. And we even offer an integrated Tanzu Kubernetes distribution into the core of vSphere, so that your administrators have the absolute best Kubernetes experience possible on your VMware infrastructure.
But the value of Tanzu isn’t linked strictly to our own Kubernetes distribution. Tanzu gives you the tools ensure that all of your clusters, VMware provided or not, have the restricted security and compliance policies defined, are protected from catastrophes, and are standards compliant.
Let’s put on our cluster operator and app operator’s hat for a moment and explore
- Go to TMC browser tab. Show the cluster group and how it contains clusters from different providers.
- Click on the “Policies” section and select the “Assignment” subsection. Call out that TMC allows you to apply policies vertically from the entire organization down to individual clusters. We can also apply policies horizontally at an application namespace level spanning multiple clusters.
- Show the “Access” tab and mention it provides central access control and rights management for your clusters or namespaces.
- Click on the “Image Registry” tab and select “Workspaces”. Call out how you can ensure that clusters only pull containers from your trusted registries.
- Mention network policies but skip clicking on it unless your customer has a specific interest there
- Click on the “Security” tab. Click “Create a security policy” and note that we provide templates that already contain best practices out of the box.
- Mention quota controls to prevent someone from hogging the cluster, but skip clicking it unless your customer has a specific interest.
- Then mention that if those policies aren’t enough, TMC provides a completely customizable way to write compliance rules that helps you shift left best practices for running applications. Click on the “Templates” subsection under the “Policies” section on the left side bar, and click on the “deploymentreplicaminimum” template. Explain how this rule ensures that developers are only allowed to deploy applications that run multiple instances so that you can promote resiliency standards for your production applications.
- Click on “Inspections” and show how you can run compliance scans against your clusters to make sure they meet standards like Kubernetes API standards and CIS Benchmark standards. This can be a huge help for your auditors to provide documentation for regulated applications. Click into failure for CIS benchmarks.
- Click on the “Cluster Groups” in the left navigation panel, click the “end-to-end” cluster group name in the resulting list, and then click on the “pez-tools” cluster name in the list. Scroll down to the bottom of the resulting page and highlight the data protection capability to backup your application manifests and persistent data. Your data is backed up to secured cloud storage that only you administrators have the keys to access. VMware can never access your data.
Tanzu Mission Control is implementing a Developer Console as well. If you click on “Applications” in the TMC sidebar, you will see the application instance that you just deployed in the e2e-workshop-w01-s043 namespace.
Enterprise Observability
A key part of operating resilient cloud applications is monitoring them. But it can be challenging to ensure that all aspects of your applications and infrastructure are captured. Monitoring point solutions can create silos of data, and can require a lot of infrastructure to store all the data points that might be significant in root cause analysis.
Tanzu enables you to offer observability capabilities as a service to your developers and operators. And Tanzu accelerates your teams by providing out of the box views of application and infrastructure KPIs that are fully customizable.
- In the TMC browser tab, click on the three vertical dots next to the “Tanzu Observability by Wavefront” item in the “Integrations” section for the “pez-tools” cluster and select “Open”.
- Explore the graphs and data a bit. Show the overall cluster view that you start in, but then click on the “Nodes” link in the “Kubernetes Objects” panel near the top of the dashboard. This highlights that TO gives you multiple perspectives to assess the health of your clusters and infrastructure.
- Highlight that TO creates these default views for you so that you immediately start getting value without having to create your own dashboards from scratch. However, these view are completely customizable. Click “clone” to show how you could customize the dashboard to your preferences by moving graphs around, adding new graphs, etc.
- Make sure to go back and delete this cloned dashboard if you actually show the interface.
- Bank in the cluster view, click the “Pods” link in the “Kubernetes Objects” panel. In the resulting view, in the “Pods” panel click the “Group By” dropdown and select “Namespace Name” to show the Pet Clinic app namespaces. Mention that these views have all been very infrastructure centric and that we can show views more specific to the application as well.
Open a tab to Tanzu Observability for your WebDB Dashboard: https://vmware.wavefront.com/u/GVQsHYwxZC?t=vmware
Now, copy your app name below, and paste into the application dropdown on the Tanzu Observability browser tab.
webdb-e2e-workshop-w01-s043
In the resulting view, point out the small, blue dots on some of the graphs near the top. Mention these are events that show when your application was deployed, and hover over one of them to show the details. Scroll around the rest of the view a bit. Remind your audience that these views are all generated by default as well when your application metrics show up so you get valueable information about your applications quickly. Click on the alerts tab at the top of the TO browser tab. Mention that TO allows you to create alerts, and that it’s AI/ML based smart alerts help your teams focus on problems without being overwhelmed by false alarms that simple “threshold” based alerts might cause.
Cross-Cloud Global Namespaces
If you have developed an application from the ground up to be cloud native and easily portable across clouds, you often have a lot of flexibility when it comes to where you deploy. But from what we’ve seen, that isn’t most applications. You have issues of data gravity that keep certain services more tied to a specific deployment location.
You also want to be able to leverage the best of breed services that every cloud has to offer no matter which cloud it is on.
But getting the services on one cloud to work with services deployed on a different cloud can be challenging. Every cloud has its own methods of configuring networking and the complexity can be daunting. It can be difficult manage the protection of your data in flight all the way from the source application to the destination and back. And you don’t have time to go back and redesign your applications to do all this.
Tanzu makes the process of connecting applications running across clouds simple for operations and applications teams by grouping all those services into a global namespace that spans multiple clusters. By leveraging open source projects like Istio, Tanzu enables applications to discover remote services through DNS. It routes network traffic to remote clusters, and manages mTLS encrypted links between clouds that ensure your data is always protected.
- Click on the tab for Tanzu Service Mesh
- Show the Global Namespace called
e2e-demo. Point out this application is running on one cluster running TKG in AWS (e2e-tsm1) and one cluster that is running on EKS (e2e-eks). Show that we have an ingress gateway that is the main ingress for the applicationistio-ingressgateway. Highlight that the catalog service is running in thee2e-ekscluster, and that we can see an mTLS protected, cross-cluster link between the shopping service and the catalog service. No special rules had to be created to enable this, and this link is being completely managed by TSM. - Hover over the catalog service name in the graph and show the performance stats. The value of exposing these KPIs right in the Service Mesh interface is to speed troubleshooting.
- Next, let’s look at how global namespaces are set up. Click on the “Edit” button for the
e2e-demoglobal namespace. On the first page of the dialog, highlight that the “Domain” field is an arbitrary domain that you will use to refer to all the services in that namespace. It doesn’t need to be a registered domain, as this name is only used by services in the namespace to reach each other. That domain is simply a signal to the mesh that it needs to look in the global namespace to resolve that domain name. Click “Next” to go to the “Service Mapping” dialog. - In the “Service Mapping” dialog, highlight the mapping rules that onboard services into the new global namespace. Point out we’ve selected a cluster and namespace combination for both clusters. Open up the “Service Preview” section on each mapping rule to show the services that are mapped in. Click next to skip to the “Security” section to highlight we’re enforcing ‘mTLS’ encryption between services and block non-encrypted traffic. Highlight that policy is managed by the mesh itself, and the applications don’t have to make any changes to enable that functionality.
- Click on the “Cancel” button to exit the dialog.
And there you have it! Tanzu helps you address all those challenges we discussed in the beginning around developing, delivering and operating resilient applications that meet the strictest security standards and follow best practices for cloud native applications.